Extensions and Developer Tools
This area collects the technical administration pages of the Control Center. It is intended for advanced administrators and developers who need to inspect, extend, or diagnose the system.
What This Area Is For
Use this area when you need to work with custom applications, background services, technical diagnostics, or developer-facing interfaces.
Who Should Use It
Only trained technical staff should use these pages. Several actions available here can affect system behavior directly.
Included Pages
| Page or tool | What it is used for |
|---|---|
| Extensions | Manage installed applications, services, resources, and custom forms or weblets |
| Top CPU Consumers | Review performance-heavy processes from the extensions area |
| Database | Inspect tables, indices, schemas, services, and locks |
| SQL Query | Run SQL manually and review execution plans |
| Filesystem | Inspect system files and binary file storage |
| Integrity Checks | Run consistency tests against the data model |
| Execution Console | Compile or execute iXML and Zymba source |
| API Inspector | Build and test REST API requests interactively |
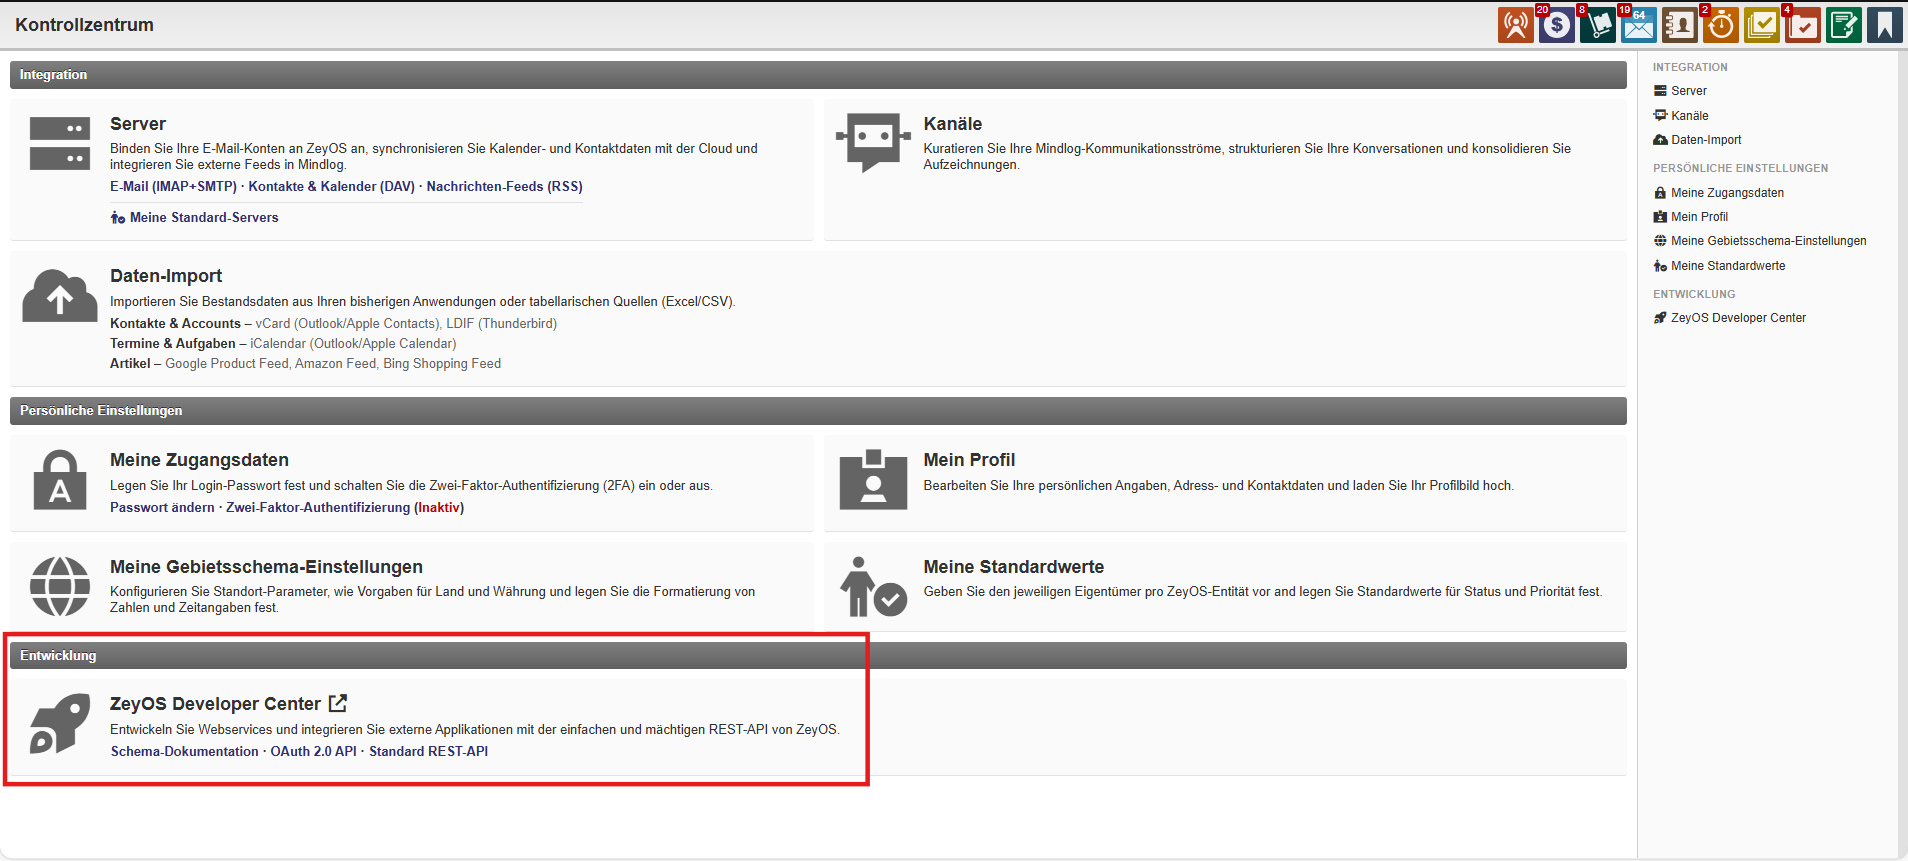
| Developer Center | Open external developer documentation for schema, OAuth, and API references |
What You See in the Live System
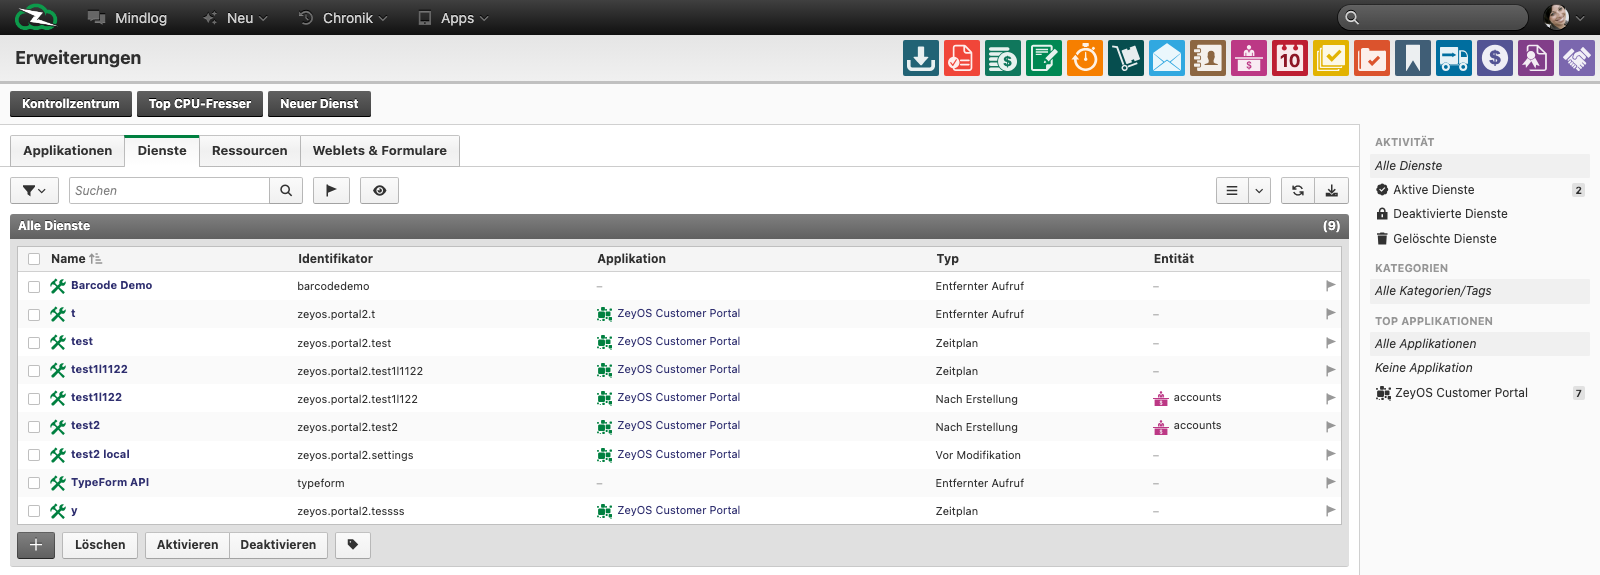
Extensions workspace
The live Extensions page is structured into the tabs Applications, Services, Resources, and Weblets & Forms. In the services view, the list shows fields such as:
- Name
- Identifier
- Application
- Type
- Entity
Database
The Database page provides tabs for Tables, Indices, Schemas, Services, and Locks. In the tables view, the live system shows technical statistics such as field counts, row counts, size, scan activity, and index-scan ratio.
SQL Query
The SQL page includes a query editor plus actions such as Execute, Explain, Analyze, Export, Reformat, and Fork.
Filesystem
The filesystem page separates system files from binary files and helps you inspect storage usage and change dates.
Integrity Checks
The checks page lists tests by identifier, description, severity, runtime, and result. It is intended for controlled consistency reviews rather than day-to-day end-user work.
Execution Console and API Inspector
The console offers compile and optimization options for technical source code. The API inspector supports common REST methods such as GET, POST, PUT, PATCH, and DELETE with a request body editor.
Typical Tasks
- Review which custom services are active.
- Inspect a table or index before planning a data cleanup or technical rollout.
- Run integrity checks before or after structural changes.
- Test an API request before implementing it in an external integration.
- Investigate storage growth in the filesystem area.
Safety Rules
- Do not use SQL, console, or database pages without a clear operational reason.
- Avoid making production changes without documentation and approval.
- Prefer API Inspector and documented extension mechanisms over direct low-level changes wherever possible.
- Separate business configuration from technical customization: custom fields and tag governance are documented in Custom Fields, Tags, and Data Extensions.
Related Topics
- Custom Fields, Tags, and Data Extensions - Data-model extension and technical field analysis.
- Logs, Audit, and Demo Data - Monitoring and escalation context.